LEED, Carbon Accounting, and the Metrics of Progress
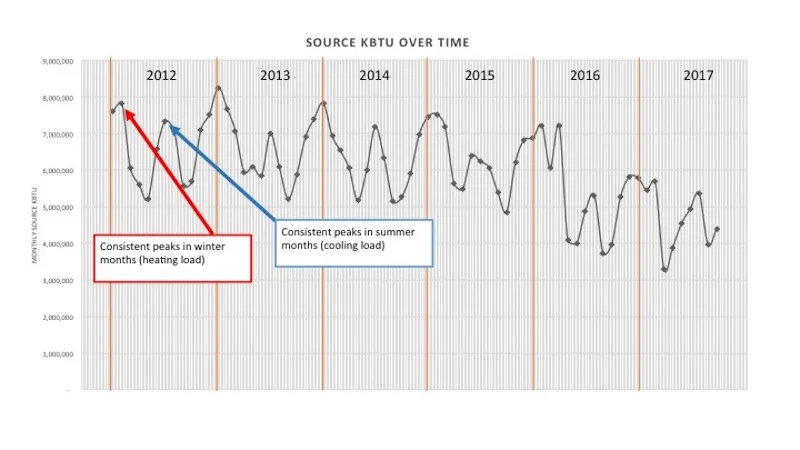
Figure 1. Seasonable Energy Consumption Pattern Observed from 2012-2017
I count myself among a subset of sustainability professionals who work in the context of both building performance and enterprise-level strategy and planning. This has long required some amount of code switching between the vernacular of the corporate sustainability world (where folks talk the language of CDP, GRI, GHG inventorying, and reductions from baselines) and the green building world (with a separate set of acronyms, terms, metrics, and relative comparisons).
Newer frameworks like GRESB, the Better Buildings Challenge, and BIT Building are starting to nudge green building efforts toward metrics that align more neatly with corporate accounting and reporting, but there’s still much to reconcile when it comes to evaluating sustainability outcomes in organizations with complex facility portfolios.
This wrangling became very relevant when WSP recently supported Legrand in the LEED certification process at its facility in West Hartford, Connecticut. Legrand is the leading provider of products that improve the delivery of power, light, and data to the spaces where people live and work.
Many ways of measuring sustainability
Like many companies of its size and type, Legrand has a multipronged CSR (corporate social responsibility) approach, including a strong focus on reducing its carbon footprint across its global operations, as evaluated through annual greenhouse gas (GHG) inventorying per the WRI/WBCSD GHG Protocol.
At the facility level, Legrand uses ISO 14001 to inform continuous improvement strategies. And in late 2016, Legrand expanded its facility-level approach to include pursuing LEED at its North and Central America’s corporate headquarters, a mixed-use office and manufacturing facility originally constructed in the early 1900s. The project used the LEED Performance Path via the still-developing Arc benchmarking platform.
Ultimately, the team agrees that its LEED efforts provided a useful additional lens that pointed them to new opportunities around sustainability. The experience also made it clear that sometimes the ultimate environmental benefit of a company's actions cannot be accounted for with the current metrics and framing of green building performance.
You can read a comprehensive case study about their experience here, and can get a glimpse below at some of the more technical complexity they experienced in evaluating their facility's energy and emissions performance.
A fuel cell that reduces emissions and complicates carbon accounting
In 2016, Legrand installed a natural gas-powered fuel cell to supply electricity for manufacturing loads. In some months, the fuel cell generates surplus electricity, which is sold to the grid. Though we can know with confidence that electricity generated from natural gas close to the consumption point is cleaner than the grid electricity available to the project building, it did present some challenges in the LEED process:
1. “Whole building consumption” and distributed generation - LEED typically evaluates energy performance based on the facility's use of energy compared to peer buildings. To facilitate this, LEED has long provided guidance to project teams on how to evaluate performance in instances where the building is connected to a district energy system for thermal energy. LEED guides these projects to use submetering and energy accounting techniques that isolate the amount of energy consumed within the project building, so that a clear picture of facility-level performance is established. For distributed electricity production, though, LEED does not currently have established accounting guidelines that allow projects to evaluate energy performance based on consumption in building end uses. As such, the Legrand facility had to incorporate 100% of the fuel cell natural gas into its LEED performance score, even though a portion of that natural gas was actually used to generate electricity used by other utility customers. This, along with some likely limitations in using an emissions-per-occupant metric in a mixed-use facility with manufacturing, led to an energy performance score of 16 out of 33 points in the Arc platform.
Also of note: greenhouse gas accounting at the organizational level typically focuses on emissions that happen within the boundary of an entity's operational or financial control, which doesn't necessarily map to the boundary of energy use within its facilities. For example, WRI’s widely used GHG Protocol distinguishes between direct and indirect emissions sources depending upon whether they come from sources owned or controlled by the organization. Distributed energy infrastructure like district energy plants, combined heat and power (CHP), fuel cells, net metering, and lease arrangements can all complicate boundary determinations and emissions factors.
2. Emissions factors and new technology - Both Energy Star and Arc treat emissions from natural gas consumption in fuel cells identically to those of combusted natural gas. While this is appropriate for some types of fuel cell technology, not all fuel cells fully dioxidize the carbon contained in the input fuel. The actual CO2 emissions from the natural gas consumed by the fuel cell might be equal to those that would occur if the natural gas were combusted, but also could range from 15% higher to 10% lower, depending on the fuel cell technology in place, based on this Catalog of CHP Technologies content on fuel cells. Without the functionality to use a more nuanced set of emissions factors, benchmarking platforms like Arc run the risk of penalizing buildings that are on the leading edge in adopting emergent clean energy technologies.
Showing reductions in a mixed-use facility with expanding production
One type of evaluation of energy performance in buildings focuses on improvement from historical conditions, regardless of comparative performance to other buildings. There are several advantages to such a perspective, including alignment with common corporate CSR goal setting approaches, a lessened opportunity or tendency to “game the system,” and an incentive for all buildings to pay steady attention to energy cost and emissions reduction opportunities.
Through the US DOE Better Buildings program, for example, Legrand has committed to reducing its energy intensity by 20% by 2022 over a 2012 baseline. The facility has been able to make significant progress through several efficiency projects, with paybacks ranging from immediate to four years. Legrand achieved this goal by the end of 2017, five years ahead of schedule. Showing reduction from a baseline can also factor into a LEED process, both as a standard approach for buildings not ratable by Energy Star and through the Energy Jumpstart pilot credit.
For some buildings, such a comparison to a historical baseline can be straightforward, particularly if the building’s usage is consistent over time. In other situations, some statistical analysis and normalizing schemes may be necessary to determine the most appropriate approach to establishing a baseline and evaluating improvements.
The Legrand facility presents a complex scenario in that the facility contains both office and manufacturing functions, there has been a recent fuel cell project that allows onsite generation of electricity from natural gas (which had the effect of increasing site energy use but decreasing source energy use and overall emissions), and the occupant density, space allocations, and production levels at the facility have changed over time.
Square footage, occupancy, labor hours, or widget output could all serve as the denominator in an intensity metric, and each will tell its own story about improvements. In making energy-efficiency improvement claims, it’s important that reductions in energy consumption are based on optimized processes and equipment rather than on a reduction in output or building utilization. Our interest in coming up with an optimal intensity metric is multipronged: 1. to ensure that energy reductions are not attributable to decreased use of the facility, and 2. to accurately evaluate performance over time, regardless of changing weather and building usage conditions.
Offices use more energy
For Legrand, we first sought to determine whether the building's energy consumption was more driven by manufacturing process loads or by the office functions in the facility. The outcome of this evaluation would help point to the most appropriate intensity metric. Using submeter data, the team developed an energy end-use breakdown (using source consumption values) that showed that manufacturing processes accounted for less than half of the facility’s consumption, suggesting that office spaces were the largest factor in overall consumption.
This finding was corroborated by a poor (r^2 of 0.1515) and inverse correlation between manufacturing labor hours and total building energy use during the baseline years. Further, when plotted over time, the facility’s monthly source energy use shows strong seasonal variations (Figure 1). Typically, in facilities dominated by manufacturing process energy, consumption does not vary significantly in a way that mirrors seasonal weather.
Based on these findings, we can conclude that using weather normalization to evaluate reductions from a baseline is appropriate, and focusing strictly on an intensity measure linked to manufacturing activity would not be robust. Though total labor hours (manufacturing plus office workers) showed a stronger correlation to energy consumption, it was still quite low (r^2 of 0.2162), suggesting that neither has a strong linear relationship to consumption, and therefore would not work well as the denominator in a single-variate intensity metric.
Energy reductions despite increased production
Figure 2 shows a comparison of various schemes for percent reduction calculations from the baseline years (2013–2016). In all schemes, the facility shows an improvement from the baseline, though the value ranges from 20.47% to 32.37%. Using square footage as the denominator in an intensity metric provides limited value when comparing performance to a historical baseline for a specific building, unless the building's size is variable. In the Legrand case, the size has not changed, and therefore the percent reduction calculation has the same outcome of 20.47% when using either a square footage-based intensity value or straight consumption.
Without performing advanced multivariate regression analysis and having a boarder set of independent variables to work with than labor hours and facility size, we have limited ability to develop a more robust analysis of how much energy consumption has been reduced at the facility.
We can feel confident in the following conclusions:
- The facility has reduced source energy, and the resulting emissions, while increasing facility utilization (Figure 3 shows an increase in labor hours over time). Decoupling carbon from economic productivity is an important achievement for any manufacturing enterprise.
- The percent improvement from the facility’s historical baseline is at least 20% based on source energy, though we do not have the data necessary to develop alternative intensity metrics that may show a larger improvement.
- These data limitations also make accurate comparative evaluations of energy performance between buildings very complex and often unrealistic. It is for this reason that Energy Star does not offer 1–100 ratings for facilities like Legrand’s.
- Legrand deployed energy efficiency and emission reductions solutions that met their objectives and were validated by external frameworks and programs such as LEED, but the specific solutions and approaches were primarily driven by their corporate sustainability commitments and business objectives. The fuel cell, in particular, delivered on the project objectives of reduced energy cost, reduced emissions, and increased reliability and resiliency, but is not the type of strategy that is readily promoted or easily accounted for in the context of the LEED framework.
Uncovering new opportunities
We also see the following opportunities for the green building, GHG accounting, and CSR industries
- Developing guidelines for the treatment of distributed electricity generation, including net-metering and surplus production sold to another consumer, in greenhouse gas accounting and evaluation of building performance
- Connecting with leading-edge research around the emissions factors associated with new technologies for electricity generation, and adjusting standards to incentivize the adoption of technologies that reduce overall emissions
- Reconciling the disconnects between how different protocols and benchmarking tools establish boundary conditions
- Embracing frameworks and metrics that nudge users toward taking action and creating additional benefits, rather than solely rewarding comparative performance or long-past investments